
One of the main marketing resources are, without a doubt, metrics, since they allow implementing and controlling strategies while they are being implemented. In addition, they facilitate greater efficiency within the campaigns; they help save costs and generate higher profits. The key to success in your strategies is to have the right tools and means that allow the correct analysis of the impact of your campaigns. Analyzing the KPIs in marketing will help you to check if the strategy is working correctly and, above all, to know if you are achieving the established objectives.
Why is it so important to analyze your indicators?
In marketing, having well-established metrics will help you understand the needs of the market and your customers. For example, you can have, as metrics (among others):
-Satisfaction levels
-Retention
-Cost of training
-Acquisition and profitability
Likewise, these metrics are an excellent monitoring and evaluation tool because they help to systematically check the progress of strategies, to detect deviations and, above all, to make better decisions.
It is a fact that a good marketing strategy could not be defined without the use of KPIs that allow you to measure and quantify the results of your campaigns, as well as to control the degree of fulfillment of the objectives.

Tips for analyzing your marketing KPIs
Here I am going to give you some tips that will be very useful to have a clear idea of your strategy and what types of KPIs you are going to measure:
Define your objectives:
The most important thing is to be clear about what your objectives are, how you can achieve them and who can act to meet each of them. For example: “300 online sales during 6 months” (instead of “increase sales”).
Be clear and concise:
As with any type of communication, KPIs in marketing must be clear so that the information they provide can be easily incorporated in order to have a greater chance of generating an action. For example: leads should be generated through email marketing campaigns.
Create quantifiable indicators:
Your KPI must be measurable in numbers. We know that feelings are not quantifiable and, for example, measuring customer satisfaction is subjective. However, if you put that same emotion on a scale of 1 to 10 according to their level of satisfaction with the service, you will be able to quantify it.
Relate your indicators:
If you make the indicators relate to each other, you will have a better and more complete view of your results in your metrics.
Give them equal importance:
Although it is a fact that there are indicators that can help you better measure your performance (e.g. ROI), each of the defined KPIs should be treated with the same importance, so that the same efforts are made for each one.
Once you have decided which metrics you will use in your strategy and you have started your campaigns, it is time to know the results.

How can inConcert help me make better marketing decisions?
When it comes to metrics, inConcert offers you a world of possibilities. Within the marketing suite, among other things, you will find the “Analytics” option, which in turn displays a menu of options that will provide you with all the information that your campaigns yield. Below I will tell you what each of them is about:
Publications
Get to know the analytics of your publications and visualize the results and performance of your content in the suite. With this option you have an overview of your daily activity. Learn about the visits and conversions you receive each day through geographic graphs, either by customer or by publications. In addition, this visualization can be filtered by category, customer, campaign and period: you decide what data you want to see.
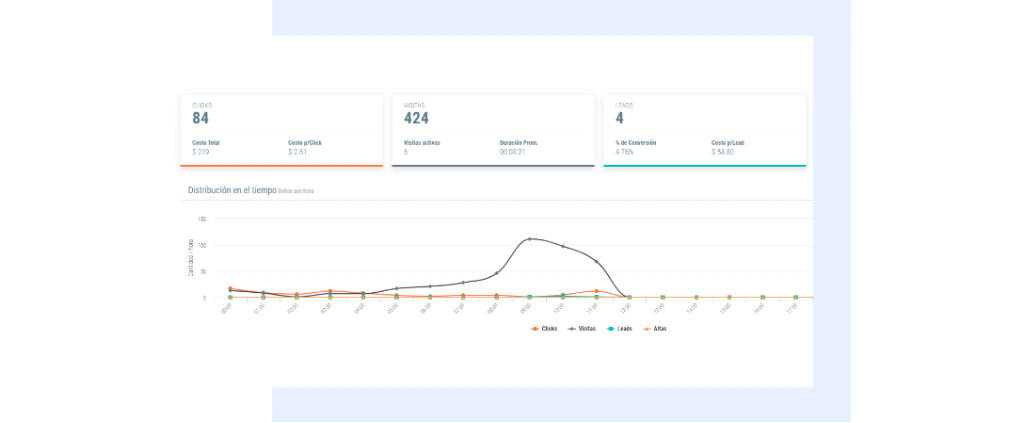
One of the ways to visualize KPIs in inConcert Markerting
Contact Center
En el dashboard de Contact Center podrás integrar tu Contact Center con inConcert Marketing, para visualizar los datos de tu operación, cruzados con tu inversión en marketing. Además te ofrece visualizar todos los indicadores relativos al desempeño de agentes, su actividad en tiempo real y resultados.
Ten acceso a un resumen diario de performance y data de todos los contactos del día.
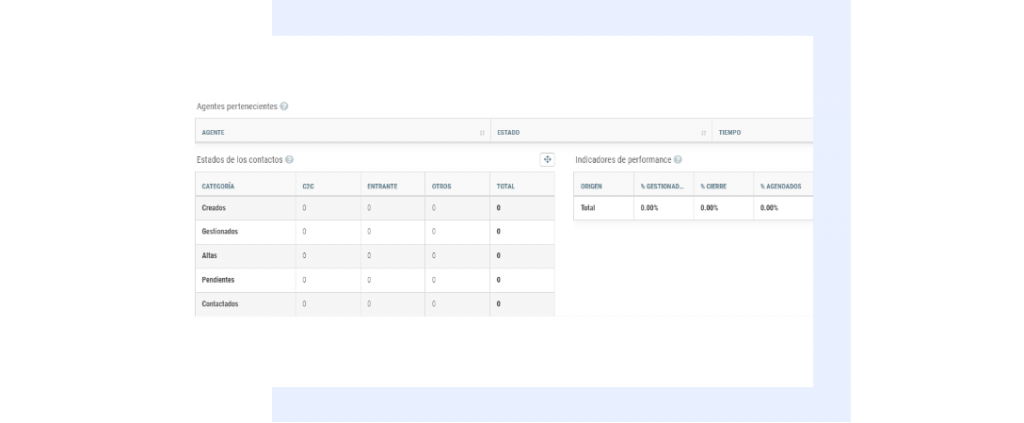
The Contact Center module in the inConcert Marketing Suite
Planning
With this option you will be able to create and visualize plans, as well as analyze your investments, results and expenses. The graph on this dashboard shows a comparison of your planning with the actual results. This way you can see if your objectives were achieved or not. View a comparison of the daily distribution of your costs, leads and registrations.
Costs
In this option you will be able to analyze your attribution and expenses in your sales dashboard, visualizing comparative graphs of investment costs and their relationship with your results, additional expenses, and more. This way you can extract very relevant data such as the cost per lead.
Reports
In the Reports section you will have endless options, you will be able to create the ones you need in order to analyze all your marketing and sales data. It also has the options to export, share and schedule periodic shipments, so that you and your team get the most out of it.
Tableros
Unlike reports, a dashboard is a report that not only organizes and analyzes your database data, but also generates configurable graphs and visual representations. You will be able to visualize and analyze your results with the predefined dashboards that best fit your needs. For example, you can visualize a summary of content per visit, a marketing summary, the details of your contact center per campaign or a summary of leads.
Targets
In our marketing and sales suite you can define your objectives clearly. For example, one of your objectives can be an exact profit figure for the year 2021. By creating targets it is easier to know if they were achieved or if you need to take action to achieve them.
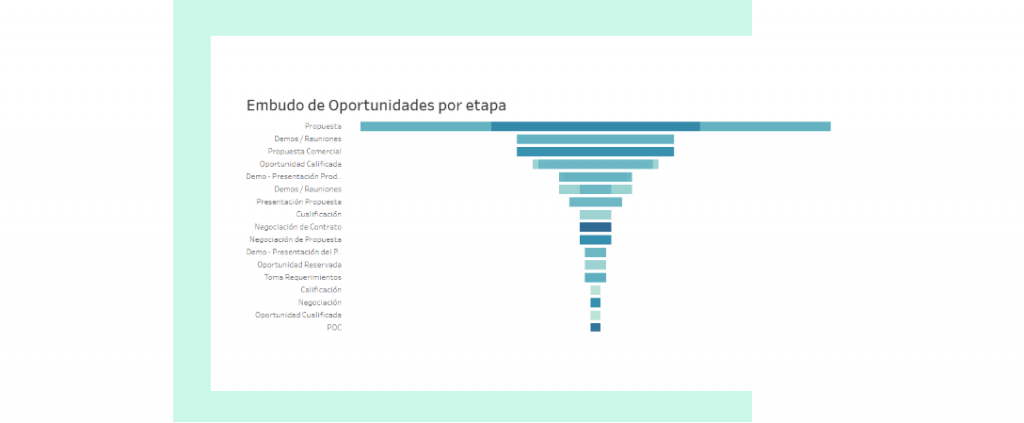
Another way to visualize data in inConcert Marketing
Knowing every detail of your campaigns through our suite’s analytics will show you where you are getting it right and what strategies need improvement. This in turn gives you the opportunity to make smarter decisions to successfully achieve your goals.
In general terms, our suite gives you the opportunity to know even the smallest details of your campaigns, contacts and agents, helps you plan your strategy and also shows you results reports, without leaving aside the fact that it organizes your database and obtains a graphical view of the performance of your publications and campaigns.
As if that wasn’t enough, it is so user-friendly that once inside you will find tutorials that will make your experience much more rewarding. Interested in learning more? Ask for a demo!