
It’s no newsflash that contact centers now manage social media contacts. Facebook, Instagram, WhatsApp, Twitter, TikTok and so many more …
In fact, more than 70% of the projects we implement and manage at inConcert include social media channels.
The recent pandemic and a greater Gen Z presence in markets has drastically transformed customer communication with brands: there are more and more users engaging on social media. That’s where they find their favorite brands, learn about special offers, interact with brand owners, make purchases and manage services. It’s a fact that 48% of consumers expect an instant response to their social media queries .
Statista
42% use social media to research products
Data Reportal

In this article we evaluate the workforce analysts’ tools for real-time monitoring and measurement of service quality on social media, the inConcert way. A simple but failproof 4-step method to keep your social channel communications effective and efficient.
4 steps to monitor social media
1) Interaction flows
2) Main KPIs
3) Agent status
4) Reports and alerts
1) Interaction flows
The first thing an analyst should do is identify the different interaction workflows. In other words, the step-by-step flow of each social media interaction. When we know what happens from the moment a customer initiates a conversation till the agent ends that interaction , we can identify possible bottlenecks and ways to improve the overall customer experience.
An example of an interaction workflow on social media:
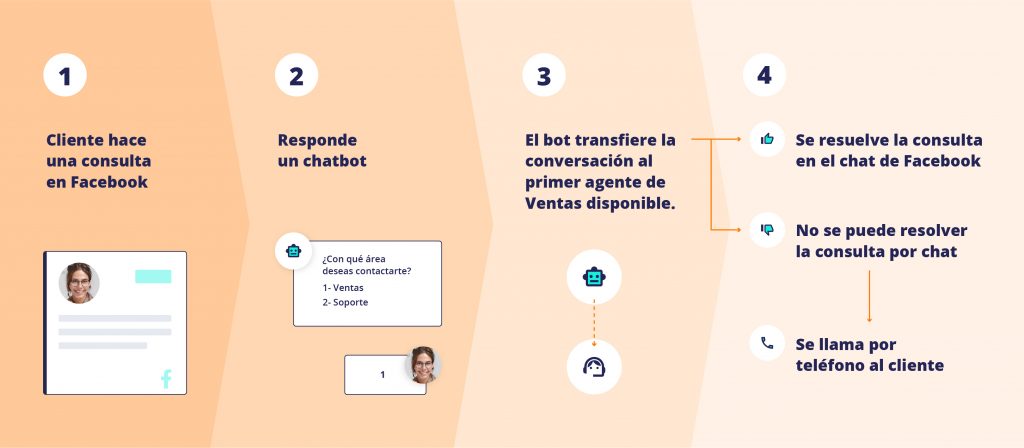
En los flujos de interacción en redes sociales se destacan dos situaciones particulares:
Use of bots:
Sometimes, the interaction is resolved entirely by an intelligent bot, without ever reaching an agent. Other times, the bot provides a first line of service (see example) and then seamlessly transfers the conversation to an agent. The workforce analyst must efficiently divide all the time spent on each step of the interaction to correctly monitor and evaluate performance. If the contact center platform doesn’t split customer service between bots and agents, it becomes increasingly difficult to accurately monitor key performance indicators.
No abandonment:
The biggest difference between social media and calls/chats is that there’s no possibility of abandonment, so there can be a backlog of unresolved interactions and this affects KPI’s like level of service, wait times and customer satisfaction. At a minimum, whatever omni-channel solution we select we should be able to easily identify these interactions to evaluate how long they’ve waited for a resolution.
2) Important KPIs
Part of any analyst’s job is to pay attention to the operation’s key performance indicators.
To maintain focus and concentrate on what’s really important, we should define KPIs that are directly associated with the type of operation and the commitment to service levels for both internal and external customers.
What should we define about our KPIs:
The formula to measure them, the target result, any non-compliance, who to alert when the performance indicator is off-target, and any actions to initiate if things go wrong.

Here are some of our favorite KPIs for social media campaigns:
– Forecast accuracy: The difference between the actual volume and the forecasted volume of interactions (%).
– AHT: Average handling time. This KPI can be custom-built based on the data provided by our platform. Generally, with social media customer service, there are no classic contact center processes like hold times and ACW (after-call work), because the interaction doesn’t need an immediate response to the customer, and management work is done in conjunction with the chat. So we can measure AHT by the time between the first interaction from the customer and the last one from the agent, or the first response and the last interaction from the agent, or even count automatic closures resulting from inactivity after a certain amount of time.
– Time between messages: The time elapsed between the customer’s message and the agent’s response. Ideally, your contact center platform should measure these times, with a brief summary per contact, and a detailed summary per message.
– Concurrency: Number of cases an agent resolves simultaneously in a given time period.
– Cases per hour: Number of interactions an agent responds per hour.
– First Contact Resolution (FCR): This indicator shows whether the customer’s query or case was resolved on the first contact, without the customer needing to contact us again for a follow up.
– ASA (Average Speed of Answer): This measures how long the consumer has to wait to be assisted by an agent.
3) Agent status
A real-time analysis wouldn’t be complete until you consider agent connectivity. We can generate multiple productivity reports relating to agent status.
Agent metrics are established based on each operation’s needs, although they’re all relying on the sum of the time and the number of times agents are in a particular status. The two main metrics in operations are utilization and occupancy.
Although both are widely used now, they often tend to be easily confused.
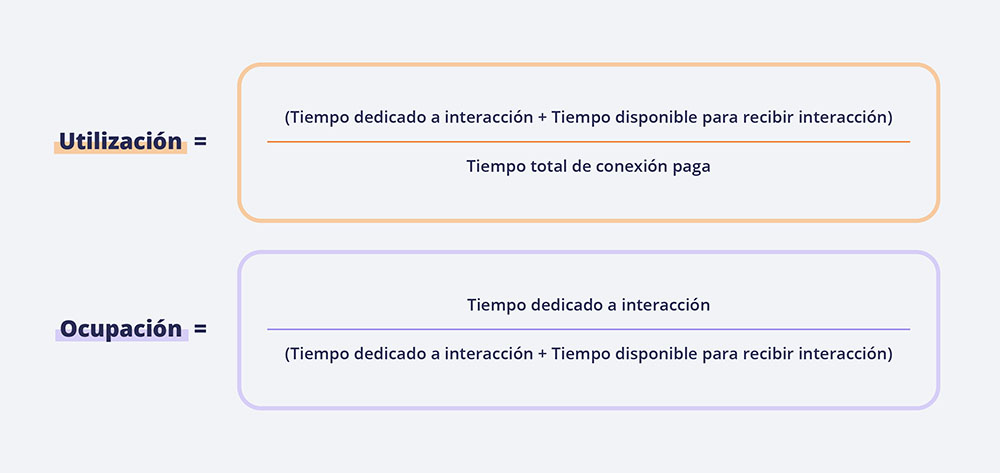
Utilization is designed to measure the time an agent spends at work or available for work, over the total (paid) time they’re connected. This helps us compare the use of productive vs. nonproductive status.
Occupancy focuses on how much of the agent’s available time is spent actually handling interactions. Occupancy doesn’t look at non-productive intervals like break times or training. This is why occupancy is recommended more as a performance indicator on digital channels, because it checks that the agent is actually working during most of their available time – that they always have assigned cases and they have the correct queues enabled, etc.
4) Reports and alerts
Finally, once the real-time analyst has defined the indicators and goals for managing the operation, they should reach an agreement with their team on the format and frequency of the report, who receives the report and how.
We recommend building a scaled matrix which specifies:
– the indicators
– the goal
– the alerts to be configured by outcome ranges
– the recommended actions for each case
– who receives the information
Let’s look at an example of a scaled matrix model for the ASA (Average Speed of Answer) indicator on a social media network, such as Facebook.
INDICATOR: ASA – Average Speed of Answer
GOAL: 120 seconds
| Result | Action | Type of alert | Scale to | Method |
|---|---|---|---|---|
| More than 120 seconds |
|
|
|
|
| Less or equal to 120 seconds |
|
|
|
|
| Average 120 seconds |
|
|
The frequency for delivering reports and alerts can be determined by the contact center platform’s capability. That is, how often it provides data updates, whether through integrated dashboards, automatic data downloads or automated emails.
By applying these four factors, the Workforce analyst will have all the tools to to maintain and improve service quality in the contact center, taking all communication channels into consideration.
👉 Discover all the specialized inConcert capabilities on Workforce Management
DISCOVER MORE ABOUT WORKFORCE MANAGEMENT IN THE CONTACT CENTER: